
Reading Time: 15 minutes
Adobe Analytics has an impressive Segmentation tool that can be used to filter your web data. You can break down your site traffic with an innumerable combination of constraints, allowing you to compare and contrast the performance of your users, your content, your everything!
The problem that comes from having such a powerful tool, is that it is complex. When you build a segment, there are a lot of options, and a lot of ways to get it wrong! One of the most common errors I’ve seen is the use of the wrong Container. There are 3 types of segment containers: Hit, Visit, and Visitors. Hit is the default, which is justifiable because it is the easiest to conceptualize. However, the visits and visitor containers are also very useful, and should not be ignored.

You can think of these containers in terms of fruit salad. In fruit salad, there are a bunch of good fruits mixed together strawberries, pineapple, grapes, as well a well as that God-forsaken honeydew. When users browse your site, Adobe receives data in that same sort of jumbled mess. Each piece of fruit in is a server call or data packet of web data.
What is a “server call”? That depends on how detailed your implementation of Adobe Analytics is. Normally, it is the data that is sent when a user loads your web page, while or more advanced integrations send server calls to track each button click or user action on the page.

Adobe’s segmentation tool needs to know what fruit you want, and how much of it you want.
If you use a Hit container, Adobe will evaluate each piece of fruit individually. Is it a grape? As a result, you’ll only get the exact “server calls” that match your criteria.
If you use a Visit container, Adobe will evaluate each bowl of fruit. Is there grape in it? As a result, you’ll get the server calls that matched your criteria, and the other server calls from that visit.
If you use a Visitor container, Adobe will look at the serving dish of fruit. Is there grape in it? As a result, you’ll get the server calls that matched your criteria, and the other server calls for that user.
Likewise, you can build segments to only include serving dishes that have both strawberry and pineapple or segments that include bowls that do NOT have that displeasing honeydew.
Translating that analogy to the world of web analytics - A simple segment would be to look for users that reached your checkout page. You set your segment to say: URL=www.example.com/buy/checkout.
A HIT container would only give you data for that page. It could tell you how many users reached the page, but it couldn’t tell you how many users reached the confirmation page – because that page appears further down the buying path.
A VISIT container would include the data for all the pages of the visits, before and after the checkout page. It is good for seeing what pages lead the user the checkout page. However, the user might have visited your “why buy” page earlier that day, in which case, that data would not be included in the results.
A VISITOR container would include all the data for any user that at some point reached the checkout page.
The segment will still be constrained by whatever date ranges are used in your report. So, if your user reached the checkout page last month, and your report is for this month, the users visits will not be included in the data.
That was the simple example. The great thing about Adobe’s segments is that you can have multiple statements with which to filter on various criteria. Let’s say you have one statement for URL=www.example.com/buy/checkout AND another for URL=www.example.com/buy/why-buy.
A HIT container would show 0’s. Why? You are only looking at one piece of fruit with the Hit container. Just like how a single piece of fruit cannot be both a grape and a strawberry, a single server call will only have one URL value. Adobe will show you 0’s to tell you – “that’s impossible”!
A VISIT container would include the data for all the pages of the visits where the user reached both the checkout page and why-buy page. If the user saw the why-buy page yesterday and the checkout page today, Adobe would not make the connection.
A VISITOR container would include all the data for any visitor that at some point reached both the checkout and why-buy page. Reaching one would not be enough.
Still with me? Well hold on to something, because you can have multiple containers in a segment.
If you have a lot of statements in your segment, often you’ll need to group them together into Nested Containers. Say you want to know how many visitors saw the why-buy page AND also visited either the checkout OR trials page. In order to use both the “AND” and “OR” operators in the same segment, you’ll need to place the checkout and trial statements in a nested container.

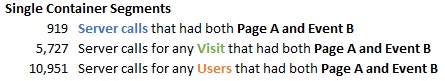
The logic between the Top Containers and Nested Containers can make segments hard to conceptualize and using the wrong type of container can yield very different numbers. Let’s say, you are interested in users that saw the Boy’s Shoes page (Page A), while being signed in (Event B). User can sign in anywhere on the site and the shoe page is not gated, so based on the various ways you make the segment, you can have different results…

If you don’t use a nested container, then it is straightforward. The Hit container will pick out those individual grapes, Visits will serve up any bowl with a grape in it, and Visitor will include any serving dish with a grape in it.
If you place the statements into a nested container, you have the ability to include more web data than you could with just the single container. You can specify that the User had to be singed in while on the Boy’s Shoes page by placing the statement in a Hit Nested Container. If you then make the Top Container: Visitor, the segment will show all the server calls for those visitors. It does not work the other way around though. If the nested Container is larger than the top container (yellow), then the result will match that larger container.

Let’s add one more statement to the segment. The nested container is still filtering for the Boy’s Shoes page with a sign-in. However, you theorize that the users are mothers who are shopping for their sons. You add a statement outside the nested container to filter on server calls for the Women’s Apparel section of the site (SubSite C).

Looking at the data for Subsite C, the Women’s Apparel section has many times volume of traffic than the Boy’s Shoes.

Since we added a new constraint, it makes sense that all of the results have shrunk.
The results on the top left are zero, since the Boy’s Shoes page is not in the Women’s section of the site.
The yellow cells no longer match the green cells, because new statement is filtering based on the Top Container
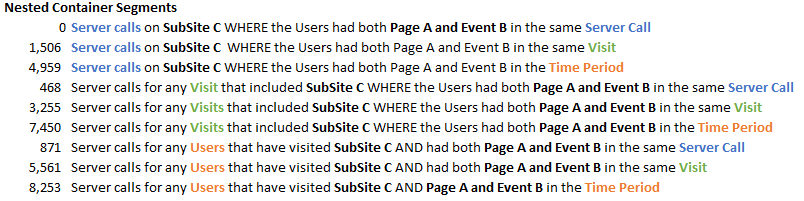
To answer your hypothesis, you’d want to compare the bottom left cell from both tables. Of the 1,552 hits from users that were signed in on the Boy’s Shoes page, 871 of those hits were on the Women’s Apparel section of the site. That is a strong indicator that those shoppers are mothers!
Nesting containers within other nested containers adds even more complexity – which I will spare you from. The simple rule of thumb is that you cannot place a larger nested container (like a Visit) into a smaller nested container (like a Hit).
Adobe’s Segmentation tool is clearly filled with nuance, but if you only use hit segments, then you are only utilizing a fraction of the functionality. Hopefully, the examples above will enable you to correctly structure your segments and learn some valuable lessons about your users’ experience.
