The Interview

oakie-dpVJtfywdX4-unsplash.jpg

Interviewing is a scary ordeal. Will they like me? Will I like them? How intense is the interview process going to be? I interviewed with Campfire Analytics a little over a year and a half ago.

I was living in the beautiful, charming city of Minneapolis. I had visited Seattle once for a weeklong trip. I did all the touristy things like going to Pike Place Market, Discovery Park, Fremont Troll, Gas Works Park, Seattle Underground Tour, etc. I had always wanted to move out to the west coast and from my one visit, I decided that Seattle was the place for me.

For most of my career, I’ve worked as a consultant and have enjoyed the freedom from corporate politics – It was important that my next role offered a similar sense of freedom. One day I searched “analytics consulting in Seattle” and Campfire Analytics popped up. As I read through the site, the four principles really stuck with me: people over profit, progress over perfection, humility over heroics, and sustainability over short-term gain. Another thing that drew me was the number of companies and tools they used. I knew this would be a great place for me to learn, and so I applied.

I received an email back for a phone screen. During the call, we talked about my experience, and what it might be like to work at a place like Campfire. The employee I spoke with, who was actually one of the founders of the company, was passionate about Campfire and you could tell he was proud of where he worked. I was invited to complete a data exercise, and I finished as soon as possible. During the follow-up interview, I presented my findings and talked through my thinking and my process. The employee I spoke with during this step talked with confidence, and you could tell he knew his stuff. I later got a call that Campfire wanted to fly me out for a round of interviews. I was excited but incredibly nervous.

I flew out to Seattle and arrived at the Campfire Office. I climbed up the stairs and my heart was pounding in my chest. “I’m 20 minutes early. That’s way too early, right? Fifteen minutes is fine, but twenty is far too much.” An employee saw me at the door and I sat on the couch.

nik-macmillan-YXemfQiPR_E-unsplash.jpg

It was time. I went into a conference room and I was told to take a seat. “Do I pick the seat closest to the door or window? Red or blue pill? Is this a test?” I sit by the window and my interview began. I met with two board members and two other employees individually.

During my interview, I was asked about my experiences, what I wanted to do, case scenarios, and who I am outside of work. I really felt like they wanted to know who I was. I was never asked about what animal I would be (answer: a duck, calm on the surface, working hard underneath) or some other question to throw me off. The interview felt real and there wasn’t time to waste on dumb questions. The board members spoke with honesty and humility, and you could clearly tell what Campfire meant to them. The two non-board employees were likable, easy to talk to, and explained what they had gained from working at Campfire.

I left feeling like Campfire was the place for me. My gut was telling me that this felt right and that I could learn from everyone I talked to. Later, I got the call extending an offer.

A year and half later, I’m proud to work for Campfire. I have learned so much about consulting and analytics. Most importantly, I have gained a community and friends.

Whether you’re a consultant or engineer, worked with companies big or small, hoping to move to Seattle or are comfortable working remotely, this is a great place to apply.

Why every workplace needs a mental health policy

 
dan-meyers-hluOJZjLVXc-unsplash.jpg

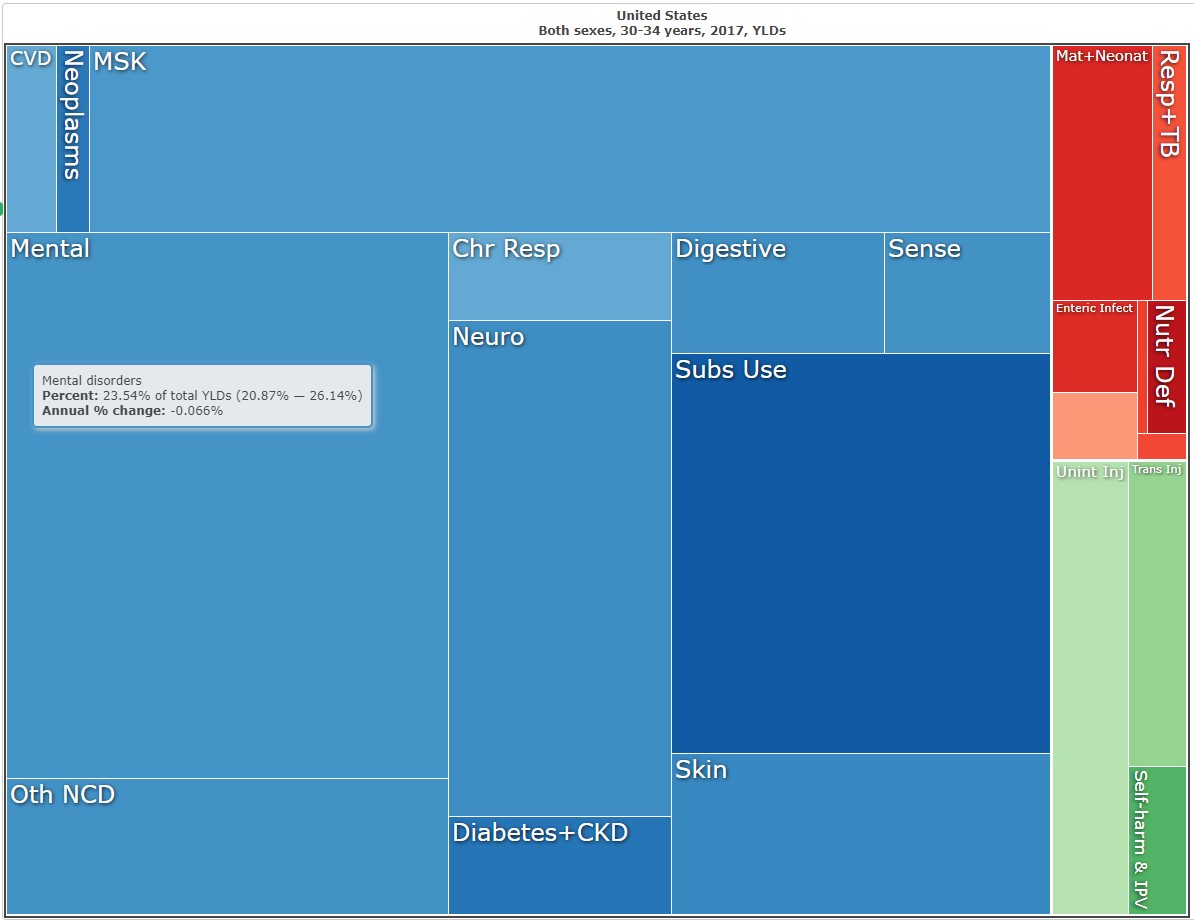
There’s no doubt that mental health is a major burden on the American workforce. In 2017, mental health was the second largest cause of disability among working-age Americans according to the Global Burden of Disease Study1. The burden of mental health disorders is largely driven by persistent depressive disorder, major depressive disorder, and anxiety disorder. To put this in perspective, these estimates suggest that for a company our size (35 employees), and average age (30-35 years), 2.4 employees each year will have a new incident of anxiety or depression, while 5.1 employees have existing (prevalent) cases. This makes for significant impact on the health of our teams.

mental_health_image.jpg

According to a study in the Journal of American Medicine Association, workers who self-report depression have a significantly higher loss in productive time due to personal health or family reasons compared to those without (5.6 hours per week vs 1.5 hours per week, respectively)2. Therefore, any workplace policy for accommodating personal health or family emergencies would miss the target if it didn’t address the needs of those with depression and/or anxiety. Ideas to remove personal and social stigmas around mental health can dissolve barriers to seeking effective treatment, and this can have meaningful economic impact.

“US workers with depression employed in the previous week cost employers an estimated $44 billion per year in lost productive time, an excess of $31 billion per year compared to peers without depression.”2 It’s in employer’s best interest to accommodate a swift recovery, since early intervention can considerably reduce the duration of an episode.

So what does the employer need to know? The median duration of a new major depressive episode is roughly 12 weeks3 and can extend multiple years in cases that are co-morbid with persistent depressive disorder. Ensuring that the employee gets immediate and stable treatment can have a large impact on their well-being for the duration of that time. So how do we put these pieces together to create a mental health policy?

At Campfire we turned a big win for mental health into a permanent benefit at the company. 

Through the work of the Diversity & Inclusion Forum, we discussed and identified the potential impact of de-stigmatizing mental health in the workplace. An employee’s story of the swift and careful accommodation from their project lead became a roadmap for us. This team member bravely shared that “the accommodations the company made when I was unwell went a long way to my getting through that time and feeling better.” Building on the success of their experience, we built a guide for our staff that includes these six things:

  1. Our commitment to the mental health of our employees, and immediate short-term accommodation away from work to find professional assistance from the outbreak of an episode.

  2. Direct links and instructions to find in-network mental health providers and expected costs.

  3. Reasonable expectations for the time required to find a psychiatric provider that is both available, and a good fit. We found that this process can take up to several weeks.

  4. A policy outlining the process for leads or board members to approve long-term accommodation with the supply of a doctor’s note. We do this to ensure employees that mental health emergencies are treated equally to all other reasons for medical and family leave.

  5. An outline of employees federal and state rights for sick, FMLA, and short-term disability to provide multiple paths for accommodation.

  6. Lastly, we underscored that sharing a condition is a personal choice, and good leadership respects the private nature of medical and safety matters.

Through the process of building and socializing this plan, we started important conversations around mental health in the workplace that any company could benefit from. At Campfire, we aim to create an atmosphere where workers feel supported, and not stigmatized for mental health needs, and this results in healthier teams.  

For questions about this article, please reach out to diegogm@campfireanalytics.com.


References

  1. “The Global Burden of Disease Study 2017” http://ihmeuw.org/4uft  (accessed 07/18/2019)

  2. Stewart WF, Ricci JA, Chee E, Hahn SR, Morganstein D. Cost of Lost Productive Work Time Among US Workers With Depression. JAMA. 2003;289(23):3135–3144. doi:10.1001/jama.289.23.3135. https://jamanetwork.com/journals/jama/article-abstract/196767 (accessed 07/18/2019)

  3. Üstün, T., & Kessler, R. (2002). Global burden of depressive disorders: The issue of duration. British Journal of Psychiatry, 181(3), 181-183. doi:10.1192/bjp.181.3.181 https://www.ncbi.nlm.nih.gov/pubmed/12204924 (accessed 07/19/2019)


Adobe Analytics Segments: Which Container Should I Use?

Reading Time: 15 minutes

Adobe Analytics has an impressive Segmentation tool that can be used to filter your web data. You can break down your site traffic with an innumerable combination of constraints, allowing you to compare and contrast the performance of your users, your content, your everything!

The problem that comes from having such a powerful tool, is that it is complex. When you build a segment, there are a lot of options, and a lot of ways to get it wrong! One of the most common errors I’ve seen is the use of the wrong Container. There are 3 types of segment containers: Hit, Visit, and Visitors. Hit is the default, which is justifiable because it is the easiest to conceptualize. However, the visits and visitor containers are also very useful, and should not be ignored.

blog-aa_segments-container_list.png

You can think of these containers in terms of fruit salad. In fruit salad, there are a bunch of good fruits mixed together strawberries, pineapple, grapes, as well a well as that God-forsaken honeydew. When users browse your site, Adobe receives data in that same sort of jumbled mess. Each piece of fruit in is a server call or data packet of web data.

What is a “server call”? That depends on how detailed your implementation of Adobe Analytics is. Normally, it is the data that is sent when a user loads your web page, while or more advanced integrations send server calls to track each button click or user action on the page.

blog-aa_segments-fruit-salad.png

Adobe’s segmentation tool needs to know what fruit you want, and how much of it you want.

  • If you use a Hit container, Adobe will evaluate each piece of fruit individually. Is it a grape? As a result, you’ll only get the exact “server calls” that match your criteria.

  • If you use a Visit container, Adobe will evaluate each bowl of fruit. Is there grape in it? As a result, you’ll get the server calls that matched your criteria, and the other server calls from that visit.

  • If you use a Visitor container, Adobe will look at the serving dish of fruit. Is there grape in it? As a result, you’ll get the server calls that matched your criteria, and the other server calls for that user.

Likewise, you can build segments to only include serving dishes that have both strawberry and pineapple or segments that include bowls that do NOT have that displeasing honeydew.

Translating that analogy to the world of web analytics - A simple segment would be to look for users that reached your checkout page. You set your segment to say: URL=www.example.com/buy/checkout.

  • A HIT container would only give you data for that page. It could tell you how many users reached the page, but it couldn’t tell you how many users reached the confirmation page – because that page appears further down the buying path.

  • A VISIT container would include the data for all the pages of the visits, before and after the checkout page. It is good for seeing what pages lead the user the checkout page. However, the user might have visited your “why buy” page earlier that day, in which case, that data would not be included in the results.

  • A VISITOR container would include all the data for any user that at some point reached the checkout page.

The segment will still be constrained by whatever date ranges are used in your report. So, if your user reached the checkout page last month, and your report is for this month, the users visits will not be included in the data.  

That was the simple example. The great thing about Adobe’s segments is that you can have multiple statements with which to filter on various criteria. Let’s say you have one statement for URL=www.example.com/buy/checkout AND another for URL=www.example.com/buy/why-buy.

  • A HIT container would show 0’s. Why? You are only looking at one piece of fruit with the Hit container. Just like how a single piece of fruit cannot be both a grape and a strawberry, a single server call will only have one URL value. Adobe will show you 0’s to tell you – “that’s impossible”!

  • A VISIT container would include the data for all the pages of the visits where the user reached both the checkout page and why-buy page. If the user saw the why-buy page yesterday and the checkout page today, Adobe would not make the connection.

  • A VISITOR container would include all the data for any visitor that at some point reached both the checkout and why-buy page. Reaching one would not be enough.

Still with me? Well hold on to something, because you can have multiple containers in a segment.  

If you have a lot of statements in your segment, often you’ll need to group them together into Nested Containers. Say you want to know how many visitors saw the why-buy page AND also visited either the checkout OR trials page. In order to use both the “AND” and “OR” operators in the same segment, you’ll need to place the checkout and trial statements in a nested container.

blog-aa_segments-segment_example.png

The logic between the Top Containers and Nested Containers can make segments hard to conceptualize and using the wrong type of container can yield very different numbers. Let’s say, you are interested in users that saw the Boy’s Shoes page (Page A), while being signed in (Event B). User can sign in anywhere on the site and the shoe page is not gated, so based on the various ways you make the segment, you can have different results…

blog-aa_segments-table1.png

If you don’t use a nested container, then it is straightforward. The Hit container will pick out those individual grapes, Visits will serve up any bowl with a grape in it, and Visitor will include any serving dish with a grape in it.

blog-aa_segments-single_container_segments.jpg

If you place the statements into a nested container, you have the ability to include more web data than you could with just the single container. You can specify that the User had to be singed in while on the Boy’s Shoes page by placing the statement in a Hit Nested Container. If you then make the Top Container: Visitor, the segment will show all the server calls for those visitors. It does not work the other way around though. If the nested Container is larger than the top container (yellow), then the result will match that larger container.

blog-aa_segments-nested_container_segments.png

Let’s add one more statement to the segment. The nested container is still filtering for the Boy’s Shoes page with a sign-in. However, you theorize that the users are mothers who are shopping for their sons. You add a statement outside the nested container to filter on server calls for the Women’s Apparel section of the site (SubSite C).

blog-aa_segments-table2.png

Looking at the data for Subsite C, the Women’s Apparel section has many times volume of traffic than the Boy’s Shoes.

blog-aa_segments-single_container_segments2.jpg

Since we added a new constraint, it makes sense that all of the results have shrunk.

  • The results on the top left are zero, since the Boy’s Shoes page is not in the Women’s section of the site.

  • The yellow cells no longer match the green cells, because new statement is filtering based on the Top Container

blog-aa_segments-nested_container_segments2.png

To answer your hypothesis, you’d want to compare the bottom left cell from both tables. Of the 1,552 hits from users that were signed in on the Boy’s Shoes page, 871 of those hits were on the Women’s Apparel section of the site. That is a strong indicator that those shoppers are mothers!

Nesting containers within other nested containers adds even more complexity – which I will spare you from. The simple rule of thumb is that you cannot place a larger nested container (like a Visit) into a smaller nested container (like a Hit).

Adobe’s Segmentation tool is clearly filled with nuance, but if you only use hit segments, then you are only utilizing a fraction of the functionality. Hopefully, the examples above will enable you to correctly structure your segments and learn some valuable lessons about your users’ experience.

Google Analytics Attribution Isn't What You Think It Is

Reading Time: 10 minutes

What is the attribution model used for Google Analytics’ standard Acquisition reports?  Last Interaction, right?  Not exactly.

The default model in Google Analytics is, in fact, Last Non-Direct Click.  While this may seem to be a subtle difference, it can have a big impact on how you attribute conversions, and how you interpret your data.  According to Google, this is when this model is useful:

If you consider direct traffic to be from customers who have already been won through a different channel, then you may wish to filter out direct traffic and focus on the last marketing activity before conversion.

But this makes some big assumptions, especially to make it the default model in all standard acquisition reports.  It can be very useful to know if a considerable percentage of your traffic is coming directly to your website to make a purchase - And this can help inform your overall acquisition strategy.

As you can see, there can be considerable differences between the two models:

GA attribution.png

While you can’t change the attribution method used for the standard acquisition reports, you can change or compare models in the Attribution Model Comparison Tool, and we fully encourage you to do just that; and not just for Last Interaction vs. Last Non-Direct Click, but take a look at how all of the models compare.  This, along with utilizing the Multi-Channel Funnels Top Conversion Paths report, provides essential insight into the roles that your various channels play.

Also, be wary of how Google Analytics defines and counts sessions.  As we all (should) know, a session (or visit) is a group of page views and interactions associated with a single user (on a single web browser) within a certain timeframe, typically the industry standard of 30 minutes (i.e. a session will end after 30 minutes of inactivity). 

However, in addition to time-based expiration Google Analytics also uses campaign-based expiration.  That is, any time a new traffic source value (e.g. utm_source, utm_medium, utm_campaign, utm_term) is recorded for a particular user Google Analytics will consider it a new session, regardless if this activity occurred within the 30-minute session window.  This can inflate the total session count for your website as well as diminish visibility into the traffic source that initially drove the visit and can also mis-credit conversions.

As an example, consider this scenario experienced by one of our e-commerce clients.  After migrating to a new e-commerce platform there was a requirement for all existing users to update their passwords the first time they logged into the new platform.  This triggered a password reset email for which the inbound links were tagged with campaign values to indicate that the user clicked through from that password reset email.  Now, if a user initially came to the website from a Paid Search listing, added an item to the cart, and then attempted to log in to complete their purchase then they would be prompted to reset their password.  After receiving the email and resetting their password then that would now be counted as a new session and the eventual purchase would be credited to the password reset email and not to Paid Search.

Now, I know what you may be thinking - just remove the campaign parameters from the links in the email, right? But it can still be useful to identify how many users are clicking through from those emails, we just don’t want to consider it a new session, nor do we want it to receive credit for the conversion.  What we’d want instead is to have Entry source dimensions (i.e. the source/campaign that initiated the visit) but also general source dimensions to provide insight into in-session activity.  One option here would be to use Internal Promotions tracking or a unique query parameter mapped to a custom dimension as an alternative to utilizing the utm parameters in these types of scenarios.

These are just a couple of examples of Google Analytics methodologies that differ from industry standards (or at least from the methodologies followed by other major web analytics providers), and yet they are not clearly called out in the Google Analytics user interface.  Rather they require a bit of digging through the documentation to find.

So be sure to keep these things in mind and do your due diligence into analytics platform methodologies before undertaking an analysis and presenting your data.  It is incredibly important to ensure that your insights are framed in a way that accurately represents what is actually happening so that you maintain trust in the data throughout the organization, and are making the correct decisions to optimize the business.


the two most important things you can do to build a sustainable a/b testing practice

Reading Time: 5 minutes

Testing graphic.png

Working with companies small and large to help establish or manage A/B testing and optimization programs has shined a light on a few common pitfalls of organizations new to testing. We understand why it happens…your site owner finally gets the go-ahead to create an experimentation practice within your company. The path of least disruption will always be to hire or appoint someone to build an independent team to run it (especially within large companies). With your existing site managers and production team already backlogged and a need to show progress, the testing show goes on in isolation.

Is this really the best way to drive results from your investment? In the immediate term, maybe, but it’s likely that as your program progresses, this question will come up more and more frequently, so why not just get started on the right foot and avoid having to force a retro-fit when (not if) it’s required. The reality of making these changes up front is that your business will get smarter and more efficient, leading to shift in how your team spends their time.

Some testing service providers may talk about how and why their “process” for test ideation through test analysis is superior to all others, but the truth is: process is the easy part and it will only carry you so far. The real value comes through internal organizational evolution and requires a commitment to change. Focus your time and effort in the following two areas to get ahead of the game:

Build a Testing Culture. The single most difficult task of establishing a testing program is organizational buy-in and participation. Everyone that is involved in site content should care about testing and want to get involved. We find this is most effectively enforced from the top down. Encourage your leadership team to ask questions like “has this been tested?” and “what tests are planned to address this issue?” Testing should have a strong position in any monthly/quarterly business reviews to both roadmap optimization and learning opportunities as well as share statistically verified customer insight and performance results from previous tests.

Equally as important in driving buy-in is championing your testing efforts through broad communication like newsletters, quarterly/semi-annual reviews, and concise documentation and communication of customer insights and business outcomes generated from testing.

Without buy-in, your isolated testing program will eventually run out of high-impact test ideas -- or worse, will struggle to maintain funding/budget to support high-impact testing.

Action your Analytics. Creating a testing practice should be viewed as a performance upgrade to your existing web/marketing analytics program. As such, the two should be integrated as closely as possible. Insights and takeaways from your analytics program are, in fact, hypotheses. Though some have higher certainty than others and may not warrant testing, experimentation allows you to dismiss speculation. Feed those hypotheses from your investigative analysis into an iterative testing plan to both validate hypotheses and implement solutions all at once. This connection between analytics delivery and test ideation will ensure a healthy pipeline of tests focused on priority business outcomes and create an engine for learning and optimization.

In summary... Building a sustainable testing program isn’t about checking a box. It’s about long-term success and won’t survive on financial investment alone. It will require a commitment to organization-wide change. If unwilling to take this leap as a team, building your testing program in a silo will lead to its questioned existence and only make it more difficult to get the approval you need when you decide to do it right the second time.

is your paid search cannibalizing your organic search traffic?

Reading Time: 5 minutes

While doing a monthly web deep dive for one of our larger clients, we noticed a sharp decline in organic search traffic. Ultimately, our investigation revealed that paid search was cannibalizing what was otherwise “free” organic search traffic. In the end, our findings led to a clear plan of action in long term testing, deeper campaign monitoring, and most importantly, implementing impactful SEM campaign optimizations.

Paid and Organic Search

There’s no doubt that there are benefits to both paid and organic search acquisition channels. There’s a reason that paid search is a multibillion-dollar business and that SEO has long been an industry buzzword. Just like anything else in life, there’s a healthy balance between paid and organic search. On one hand, you don’t want to be displacing large volumes of organic search traffic, but at the same time, some degree of cannibalization is inevitable (paid and organic links competing).  But before we get into what is a healthy balance of paid and organic search, it’s important to understand if paid search is in fact cannibalizing organic search traffic.

Signs of Cannibalization

How do I diagnose that my paid search efforts are cannibalizing my SEO efforts? It involves (1) measuring the relationship, (2) looking for other possible causes and (3) testing the findings.

Determine the historical relationship between the business’s paid and organic search traffic. No two businesses are built the same and the relationship will vary. You’ll want to monitor how the two channels are performing in silo while also quantifying the strength of that relationship.  In our case we trended visits and performance and noticed a massive drop in organic search while seeing the exact opposite for paid search. We further quantified this by running a regression on the traffic sources and found a Pearson Coefficient of -0.80 for traffic (strong inverse relationship)!

seo sem.PNG

But I always remember what my intro to stats professor told me, correlation isn’t always causation! Step two is looking at other organic and paid search drivers that might validate or discount cannibalization. We looked for changes in keyword rank, consolidation in pages and any other signs of losing relevancy and nothing stood out [from organic search]. We then moved into paid search, this is where we found some gems… It was revealed spend did increase sharply, and the majority of the high performing keywords now existed in multiple campaigns across channel, suggesting that traffic cannibalization as a potential culprit of the performance decline.

Finally, to further validate our hypothesis of traffic cannibalization, we leveraged our analysis to reprioritize our client’s testing & optimization pipeline. Testing was focused on markets with high paid search saturation. In these markets, we selectively throttled back bids on keywords present in multiple campaigns. In each test, organic search traffic and conversion volumes dramatically increased when paid campaigns were dialed back, confirming our hypothesis that significant cannibalization was taking place.

From what started as an exploratory analysis on a dip in traffic, the Campfire Analytics team was able provide better optics into marketing performance and implement change to maximize outcomes from media spend. This example shows that ideas alone are ineffective without educated action. Specific recommendations and optimizations below.

Search recommendations.png